Spatial Field Trend Analysis and Factor Analytic Model Under Linear Mixed Model in Multi- Environment Trial Data: The Case of Durum Wheat in Ethiopia
ABSTRACT
In multi-environment trial (MET) data analysis, breeders are usually interested in performance of genotype across target environment (broad adaptation) and performance of genotype at individual environment (specific adaptation). Hence, the main objective of this study was to predict genetic potential of durum wheat across environment and to observe improvement in heritability across different statistical methods. MET data of durum wheat was taken from Debre zeit Agricultural Research Center (DzARC) of Ethiopian Institutes of Agricultural Research (EIAR) which was planted in 2011 and 2012 year of main season. Then, for the data analysis the standard linear mixed model (LMM) is applied using ASREML packages of R software considering spatial field trend at individual trial and factor analytic model among trial. The result of this study (Table 1) show that on average, DSP2009- Off.F4.1H.378-meh.4H.187 genotype perform better than all other genotypes while, the performance of UC1113GPCLR198001/59 genotype is less compared to other genotypes. In addition, when looking at improvement in heritability (Figure 1) across three different statistical methods spatial field trend plus MET together indicate high improvement in heritability than the classical methods.
KEYWORDS
Durum wheat; Heritability; MET; LMM
INTRODUCTION
Durum wheat is one of the widely grown crop and economic advantages in Ethiopian. Hence, lots of research has been done to improve seeds and quality of durum wheat Hailu 1991. Accordingly, 40 improved durum wheat has been released for commercial use since 1996. Potentially, durum wheat is grown at the highlands (1800-2800 meters) of Ethiopia undervert soil Tesemma [1]. Currently, the production and productivities of the durum wheat could be 80% of the bread wheat. Historically, the yield level of durum wheat in Ethiopia is about 80% of that of bread wheat, which has been attributed partly to less favourable crop growing environments and management practices Srivastaval et al. [2]. However, new high yielding semi-dwarf durum have been developed that have yield potential equal, or even superior to the highest yielding bread wheat in some areas Abinasa et al. [3]. As the price of durum is often higher than that of bread wheat, it is a promising and viable alternative cash crop for farmers. Statistical analysis of multi-environment trial (MET) data currently increasing from time to time in plant breeding to precision and accuracy in estimating genetic potential. In MET data analysis, there are several information about variation in each specific trial like spatial field trend, extraneous variation and global variability Damesa et al. [4]. In combined analysis, factor analytic (FA) model is the most powerful in MET data analysis in capturing correlation among trials and how this correlation would affect genetic selection. Routinely, field spatial variability within a trials and heterogeneity between trials usually occurs in field experiment and need to be accounted unless it will result in biased and inefficient estimates of genetic effect Tadese et al. [5]. In a classical statistical analysis, historically authors usually consider a common error in experimental field but, which is sometimes not correct.
Breeders are mostly interested in overall performance of genotypes across target environment as well as specific adaptations of each genotype when conducting MET data analysis.
The techniques of genotype by environment interaction effect models permit for separate genetic variance for individual trials and provides parsimonious, and interpretable model for the genetic covariances between pair of trials.
Therefore, in this study two phase of statistical analysis is employed by using linear mixed model (LMM). In the first stage, individual trials are analysed for the spatial field trend, extraneous variation and global variability. In the second stage, using information from each trial, the trials are combined through factor analytic model (FA) and included in the standard LMM.
MATERIALS AND METHODS
Data used for this study was taken from Debre zeit Agricultural Research Center (DARC) of the Ethiopian Institutes of Agricultural Research (EIAR). The experiment was conducted in 2011 and 2012 in randomized complete block design of 23 genotypes in 2011 and 18 genotypes in 2012.
The layout of an experiment is a rectangular arrangement like
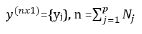
jth trials j=1. . . p, with Nj, plots consist of rj, rows and cj columns s
that Nj = rj x cj; Smith [6]. Then, for the analysis of field trend, the
vector of the response variable  would be sorted with rows
within columns for all environments before analysis.
would be sorted with rows
within columns for all environments before analysis.
Then, the standard linear mixed model approaches employed would be computed as,
 is given by
y = X+ Zu+ e ----------------------------(1)
where  and
and  are vectors of fixed effect and random
effect factors respectively where as
are vectors of fixed effect and random
effect factors respectively where as  and
and  be associated design matrices for fixed and random effects while the former
one assumed to be of full column ranks and e is vector residual.
Therefore, the joint distribution of
be associated design matrices for fixed and random effects while the former
one assumed to be of full column ranks and e is vector residual.
Therefore, the joint distribution of  assumed to be,

Where γ and ∅ are variance parameters. Then, the distribution
of y would be, Gaussian distributions with mean Xτ and variance
matrix H=  .
.
In addition, the error term contains vectors of sub error
{ej}, where  is vector of plot errors for a given jth trial
and decomposed into a spatially dependent process ξj while
independent white noise process ηj. The matrix of the error term
for trial j can be extended as
is vector of plot errors for a given jth trial
and decomposed into a spatially dependent process ξj while
independent white noise process ηj. The matrix of the error term
for trial j can be extended as 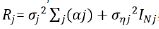 ,
,
where Σj is the matrix of spatial correlation associated with αj
with variance  while
while  is variance parameters of the white noise process. The spatial process ξj is assumed to be the second
order stationary given that the correlation between plot depends
on the lag distance given that the columns and row dimensions
are separable. Hence, one can write Σj=Σj⊗Σj, where Σcj and Σj
are the two-dimensional correlations respectively. Number of
research findings Oakey [7]; Tadese et al. [5] show that the first
order autoregressive which can be denoted by ar1xar1 explain an
appropriate variance structure in field trend.
is variance parameters of the white noise process. The spatial process ξj is assumed to be the second
order stationary given that the correlation between plot depends
on the lag distance given that the columns and row dimensions
are separable. Hence, one can write Σj=Σj⊗Σj, where Σcj and Σj
are the two-dimensional correlations respectively. Number of
research findings Oakey [7]; Tadese et al. [5] show that the first
order autoregressive which can be denoted by ar1xar1 explain an
appropriate variance structure in field trend.
u is a random factor with the sub vectors of  , where
  is the vector of effect for the ith random term, i=1. . .q. The matrix Z
therefore can be partitioned in to [Z1 . . .Zq] and the sub vectors of
u are assumed to be mutually independent. But the variance matrix
Gi for the ith random term has many possible forms including the
standard variance component structure
is the vector of effect for the ith random term, i=1. . .q. The matrix Z
therefore can be partitioned in to [Z1 . . .Zq] and the sub vectors of
u are assumed to be mutually independent. But the variance matrix
Gi for the ith random term has many possible forms including the
standard variance component structure  .
.
In a plant breeding program, breeders want to measure how well total genetic effects can be predicted through stability analysis and this requires special statistical methods. This describes the proportion of the genetic variance to the total variance. If heritability is low, then little advance can be made from phenotypic selections while high in heritability best lines and parents can be selected for future crossing so that further enhancing genetic gain in the breeding program.
Let ug be the mpx1 vector of genetic effect for m varieties for
each p environments ordered as varieties within environments. It
represents a two-dimensional (varieties by environment) array of
effect, namely  , where
  . Assuming, the associated
variance structure has separable form with
. Assuming, the associated
variance structure has separable form with 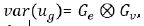 , where Ge and Gv are the symmetric p x p and m x m component
matrices for environment and varieties, respectively. When Gv= Im,
just for simplicity, therefore
, where Ge and Gv are the symmetric p x p and m x m component
matrices for environment and varieties, respectively. When Gv= Im,
just for simplicity, therefore  , and the matrix
 is the so-called genetic variance matrix. Therefore, the
standard linear mixed model can be extended as;
is the so-called genetic variance matrix. Therefore, the
standard linear mixed model can be extended as;
 , -----------------(2)
The fixed effect τ includes environmental main effects and trial specific effects for extraneous field variation Oakey et al. [7].
ug is variety effects at each environment with associated design
matrix  and
and  comprise an additional random effect with
design matrix Z0.
comprise an additional random effect with
design matrix Z0.
Therefore,
In multi-environment trial (MET) data analysis, there are
many possible form of genetic variance matrix structures while
using linear mixed model and the standard structure is given
by  , where
  and
and  are the variance
components for variety main effects and interaction effects
respectively, Jp is a p x p identity matrix. This implies that all
environments have constant genetic variance and all pair of
environment has the same genetic covariance. In this case, since
inefficient estimation, Piepho [8]. consider an alternative variance
structure model which is known as Factor Analytic model which
is analogous of AMMI model. In addition, this model captures the
nature of heterogeneous variance covariance structures.
are the variance
components for variety main effects and interaction effects
respectively, Jp is a p x p identity matrix. This implies that all
environments have constant genetic variance and all pair of
environment has the same genetic covariance. In this case, since
inefficient estimation, Piepho [8]. consider an alternative variance
structure model which is known as Factor Analytic model which
is analogous of AMMI model. In addition, this model captures the
nature of heterogeneous variance covariance structures.
The model for factor analytic is given as
 ,
,
Where
 .
.
While fitting linear mixed model in this study, spatial field trend fitted first for each environment and tested for the potential existence of field trend between the neighbor plots. Furthermore, global variability and extraneous variation has checked and included into the standard linear mixed model. Finally, trial across environment is combined keeping their specific trial information like spatial field trend and included in a LMM through factor analytic model.
RESULTS
The summary statistics (Table 2) indicate that the average performance of all genotypes at RB_PVTOH2011 is higher (4.39 t/ ha) than other trials while the potential of AK_PVTOH2011 trial is less than all others. Furthermore, the number of rows and columns used for spatial field trend analysis are included in Table 1 with the number of genotypes in 2011 and 2012.
In multi-environmental breeding program, looking at performance of each genotype and the rank change across testing environments is so important for selection. Therefore, the response of these genotypes in respective environment goes to determine selection of genotype for the next trial or for release. Hence, when trials are correlated, ranking of genotypes similar so that the one best performing genotype/s at specific environment has similar performance with the one highly correlated environment.
In Figure 1 MJ_PVTOH2011 has strong positive correlation with DZ_PVTOH2011, DN_PVTOH2011 and DN_PVTOH2012 as an example. So, if a researcher selects the best material based on MJ_PVTOH2011, it will be similar selection for DZ_PVTOH2011, DN_PVTOH2011 and DN_PVTOH2012. But if environments are negatively correlated, selection of best genotype is little bit challenging since high rank change among genotype from environment to environment. That means, the one with good performing in one environment will be poor performing genotype in another environment with the one negatively correlated. In addition, when the environments not correlated either negatively or positively, they independent environment so selecting best material in one environment has an average performance for another environment with the independent environment. The correlation among trials can also be plot using biplot graphical analysis (Figure 2) in which the angle between two lines indicate the strength of correlation between two environments. Less angle indicates high positive correlation approximately less than 90’ while near 90’ between the angle indicate the environments are independent. If the angle between the line is greater than 90’, then the environments are more negatively correlated. In field experiment, heritability analysis is also one objective in plant breeding program. High in heritability implies high in selection since it measures how accurate we predict in a total genetic effect.
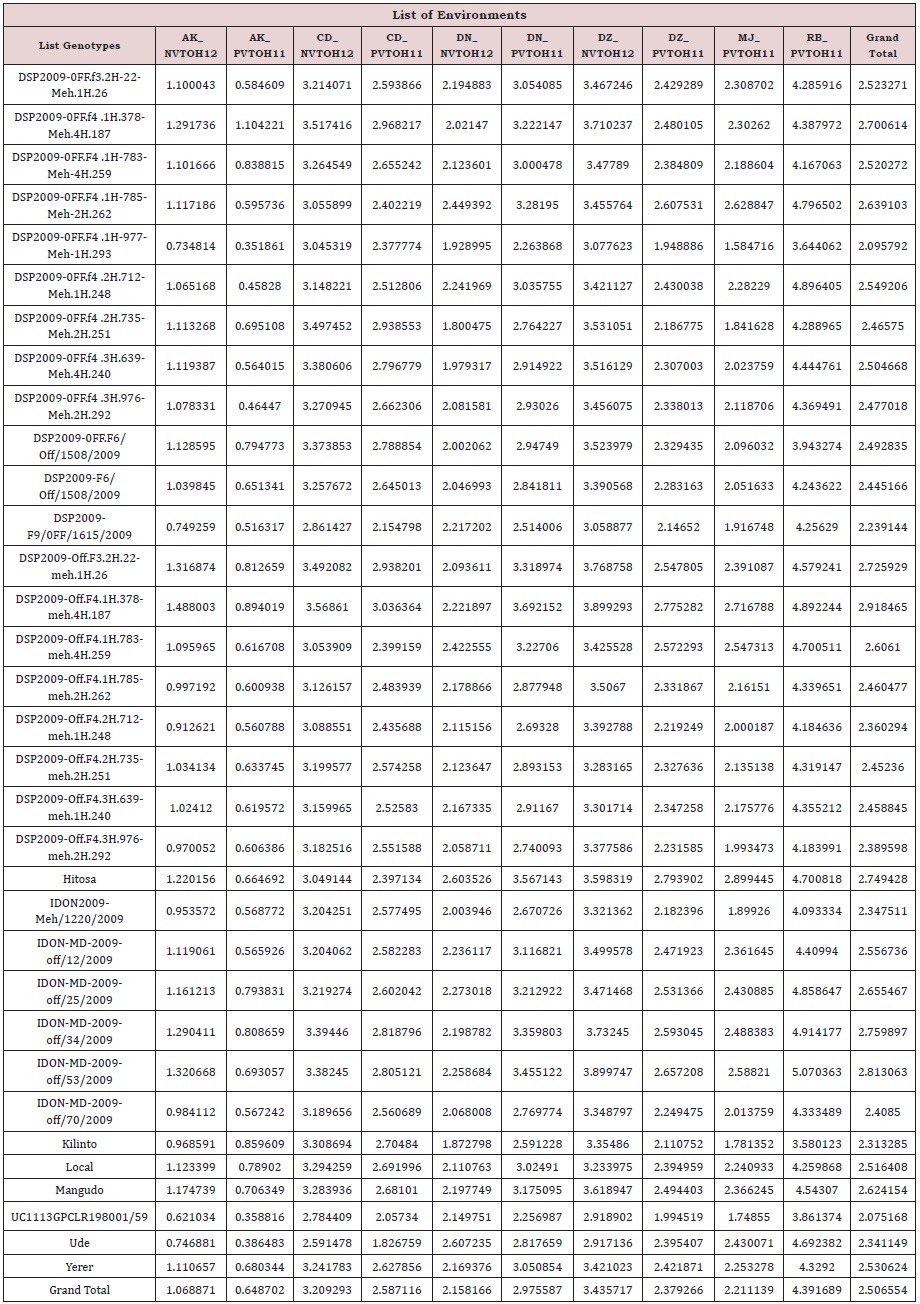
In case of low heritability, few advancements can be made from phenotypic selection a plant breeding. Therefore, heritability calculation across three statistical methods is employed in this study. High improvement in heritability observed through the use field trend spatial analysis plus MET data analysis as indicated in Figure 3. In MET improvement in heritability comes from correlated trial that means while calculating heritability it uses information from the one correlated with it. Predicted value in Table 2, indicate that DSP2009-Off.F4.1H.378-meh.4H.187 genotype perform better (2.92 t/ha) than the rest of candidate materials on average while relatively UC1113GPCLR198001/59 genotype perform lower (2.075 t/ha) than the others on average. Generally, most genotypes perform better than the local check which is 2.52 t/ha as indicated in Table 2. When looking at potential environment, RB_PVTOH11 environment perform better than other environment with 4.39 t/ ha yield and in reverse environment AK_PVTOH11 is low yielder (0.65 t/ha) when compared with others.
DISCUSSION
In this study, the advantage of modelling spatial correlation through neighborhood plot and variance covariance structure between trial through factor analytic model in genetic prediction is boldly reviled. Furthermore, modelling field spatial correlation plus MET through FA together under linear mixed model also indicate high improvement in heritability analysis which is also strongly recommended by recent study. For MET breeding program, restricted maximum likelihood estimation of LMM is more robust model in prediction of genetic potential across environment. Among the candidate genotype tested across ten environments, on average DSP2009-Off.F4.1H.378-meh.4H.187 genotype is the best performing material while UC1113GPCLR198001/59 genotype is performed less than the other on average.
ACKNOWLEDGMENT
Our great thanks go to Debre zeit Agricultural Research Center (DzARC) of Ethiopian Institutes of Agricultural Research (EIAR) mainly durum wheat breeding programme for providing the data used for this study and financial support.
KEYMESSAGE
The study demonstrates that the use of spatial field trend under linear mixed model (LMM) of combined data improve genotype selection in durum wheat data. Accordingly, on average DSP2009- Off.F4.1H.378-meh.4H.187 genotype indicate better performance than other genotypes.
REFERENCES
- Tesemma T, Belay (1991) Morphological diversity in tetraploid wheat landrace populations from the central highlands of Ethiopia. Hereditas 114: 171-176.
- Srivastava JP, Damania AB, Pecetti L (1988) Landraces, primitive forms and wild progenitors of macaroni wheat, Triticum durum: Their use in dry land agriculture. In: Miller TE, Koebner RMD(eds) Proceedings of 7th International Wheat Genetics Symposium, Oxford University Press: Oxford, England, pp. 153-158.
- Abinasa M, Amsalu Ayana, Geremew Bultosa (2011) Genetic variability, heritability and trait associations in durum wheat (Triticum turgidum L. var. durum) genotypes. African Journal of Agricultural Research 6(17): 3972-3979.
- Damesa TM, Möhring J, Forkman J, Piepho HP (2017) One step at a time: Stage-wise analysis of a series of experiments. Agron J 109: 845-857.
- Tadese D, Lakew B, Taye G (2019) Spatial analysis in multi environment trials of malt barley in Ethiopia. African Crop Science Journal 27(3): 515- 527.
- Smith AB, Cullis BR (2001) The analysis of crop variety evaluation data in Australia. Australian and New Zealand Journal of Statistics 43:129- 145.
- Oakey H, Verbyla A, Cullis B, Pitchford W (2007) Joint modelling of additive and non-additive (genetic line) effects in multi-environment trials. Theoretical and Applied Genetics 114: 1319-1332.
- Piepho HP (1997) Analyzing genotype-environment data by mixed models with multiplicative terms. Biometrics 53: 761-766.
Article Type
Research Article
Publication history
Received date: July 09, 2021
Published date: August 02, 2021
Address for correspondence
Mekuria Dejene, Debre zeit Agricultural Research Center, Ethiopia
Copyright
©2021 Open Access Journal of Biomedical Science, All rights reserved. No part of this content may be reproduced or transmitted in any form or by any means as per the standard guidelines of fair use. Open Access Journal of Biomedical Science is licensed under a Creative Commons Attribution 4.0 International License
How to cite this article
Diriba T, Mekuria D. Spatial Field Trend Analysis and Factor Analytic Model Under Linear Mixed Model in Multi-Environment Trial Data: The Case of Durum Wheat in Ethiopia. 2021- 3(4) OAJBS.ID.000313.
Figure 1: Genetic correlation across 10 durum wheat environments through heatmap plot.
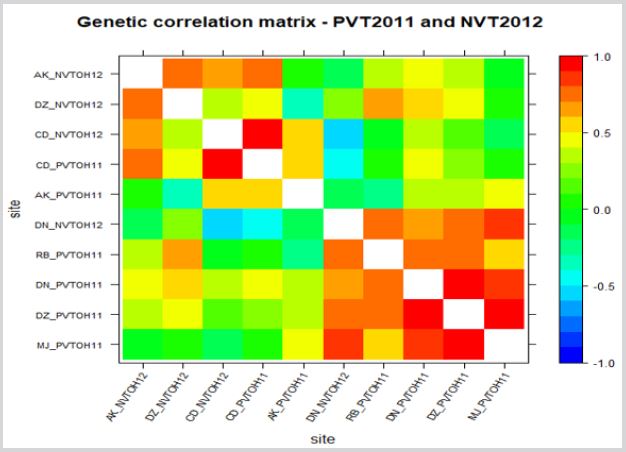
Figure 2: Biplot of genotype by environment in 10 durum wheat environments in Ethiopia.
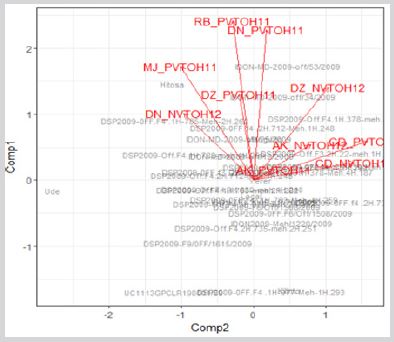
Figure 3: Improvement in heritability across three statistical methods in MET data of durum wheat in Ethiopia.
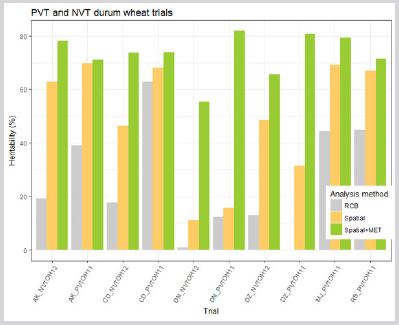
Table 1: Summary statistics of durum wheat across ten trials in Ethiopia.
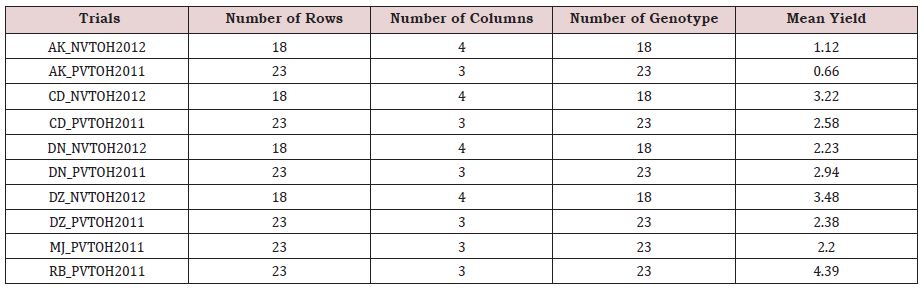
Table 2: Predicted values of each genotype across each environment of durum wheat in Ethiopia.